Stock Insights
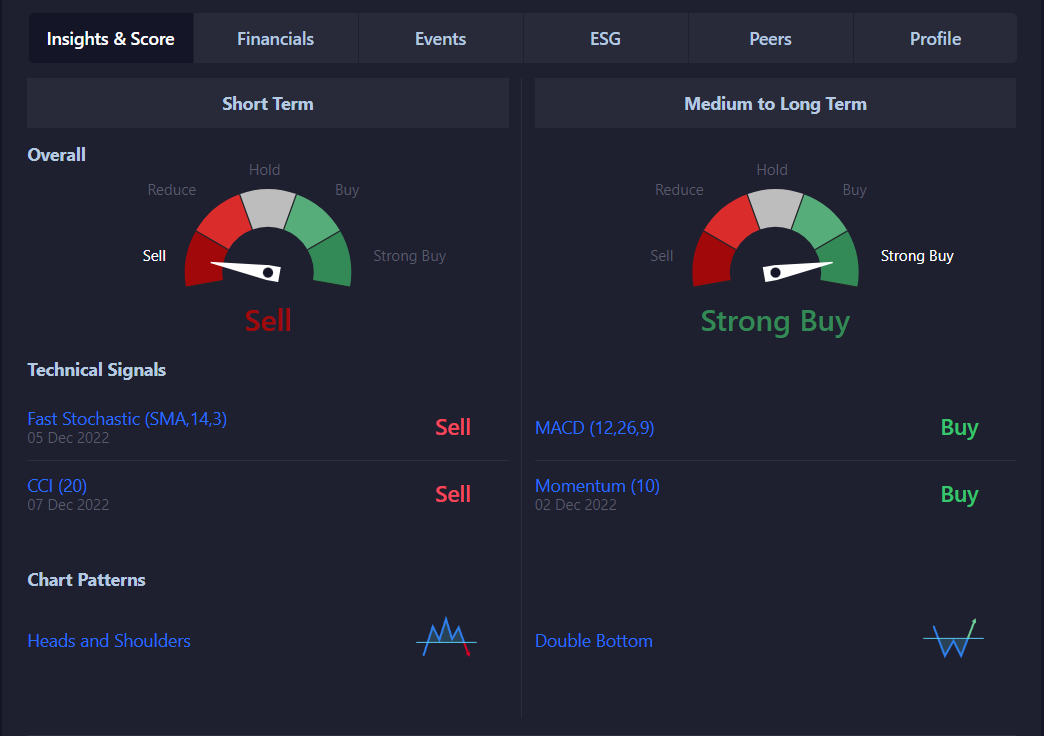
Is the stock a Buy, Sell or Hold? We analyze a stock’s price movement based on a basket of technical indicators to derive an aggregated assessment.
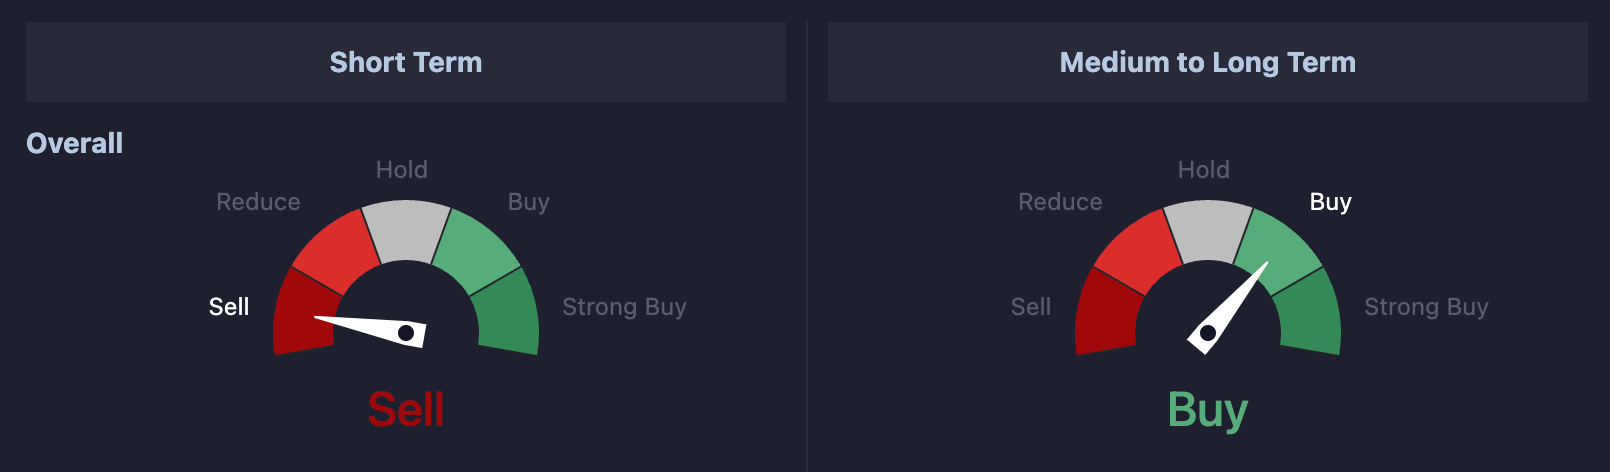
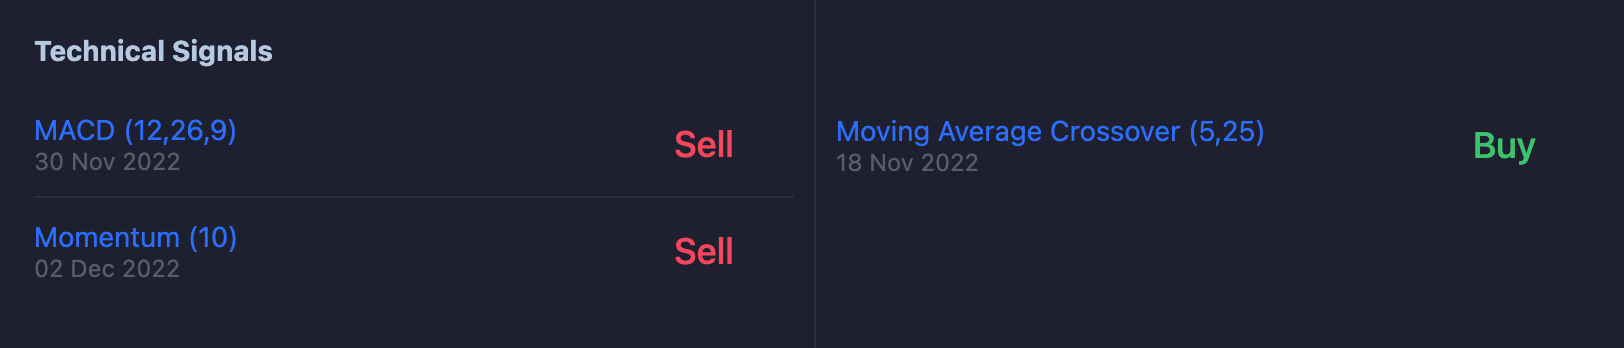
Stocks are monitored for our technical indicators and display when a buy or sell signal has occurred. For example, when a stock’s RSI indicator goes into overbought territory, or if there’s a Golden Cross signaling a possible trend reversal, users can be informed and act on the signal early.
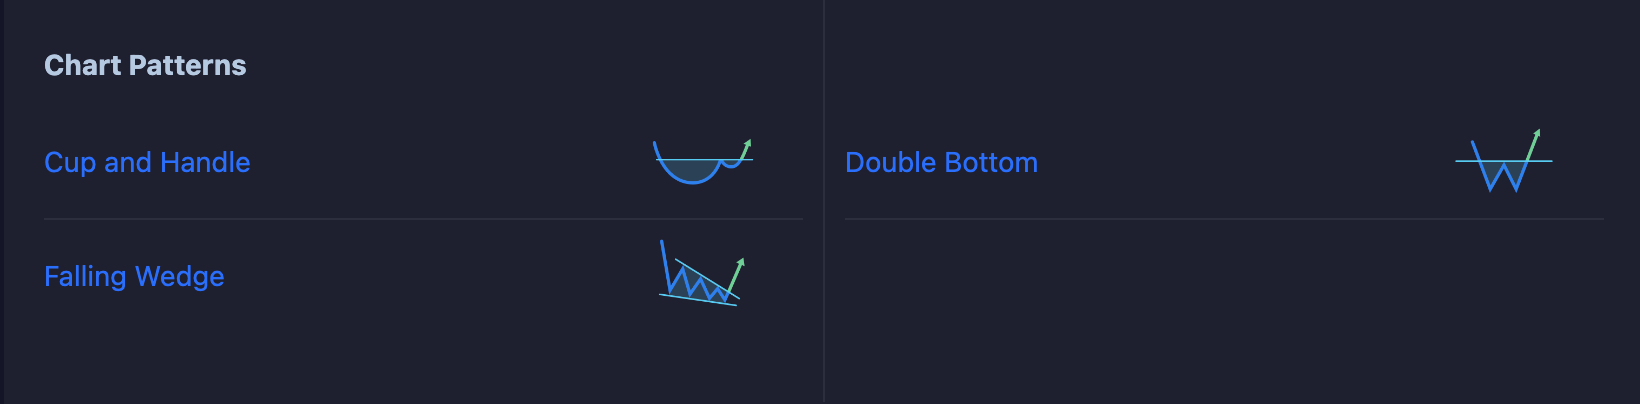
Tried and true chart patterns help an investor determine whether a trend will continue or reverse. Stock insights display when a chart pattern has formed saving the user from needing to check and analyze stock charts one by one.
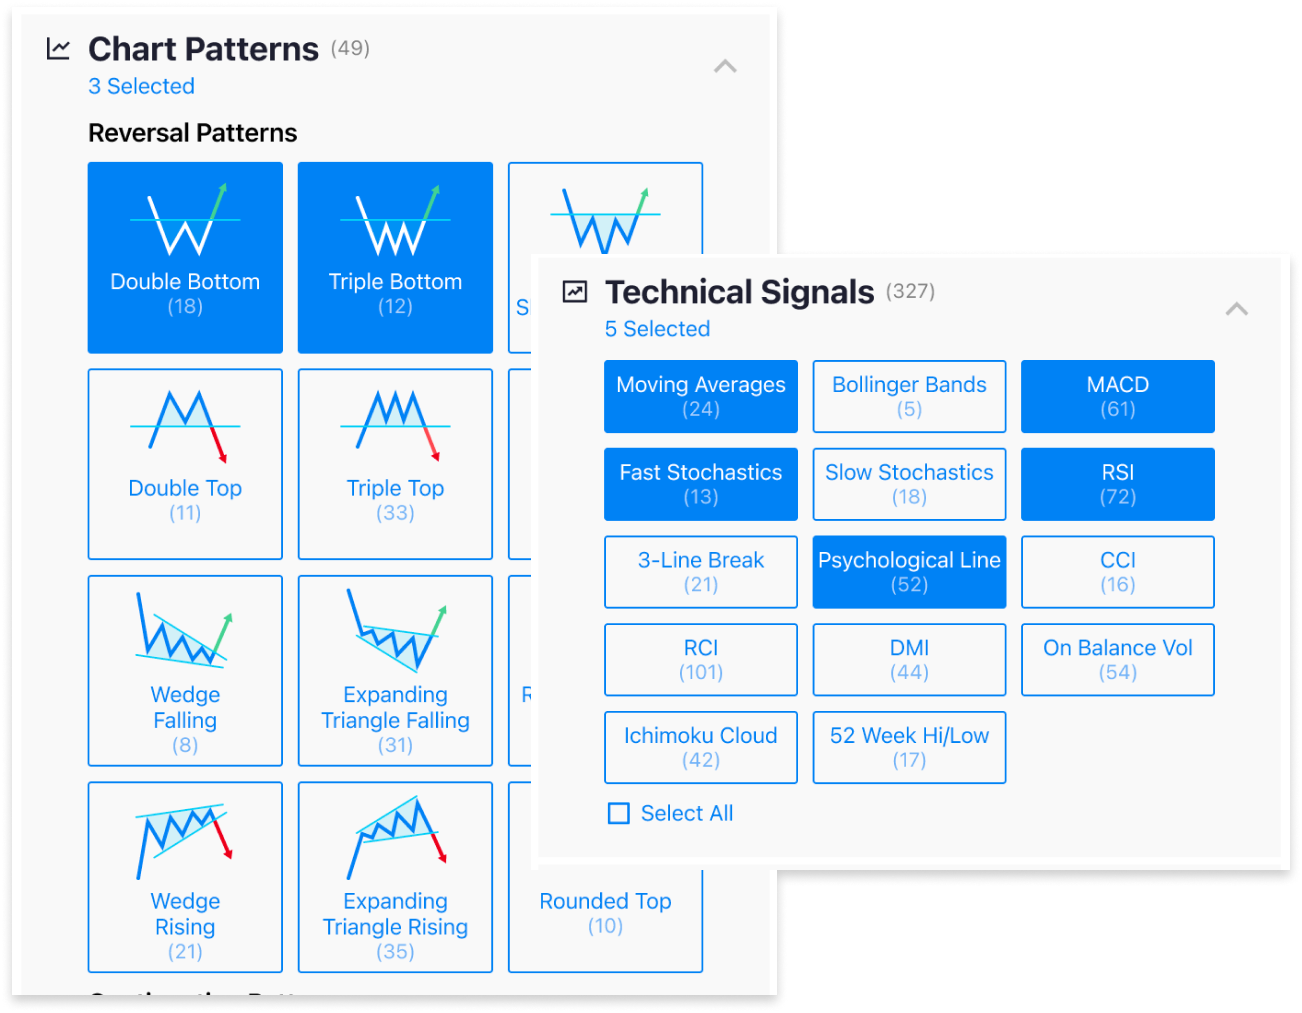
Trade Signals and Charts Patterns can also be integrated into our Stock Screener so you can find all stocks where a particular signal or pattern has occurred.